4.10. API統計情報
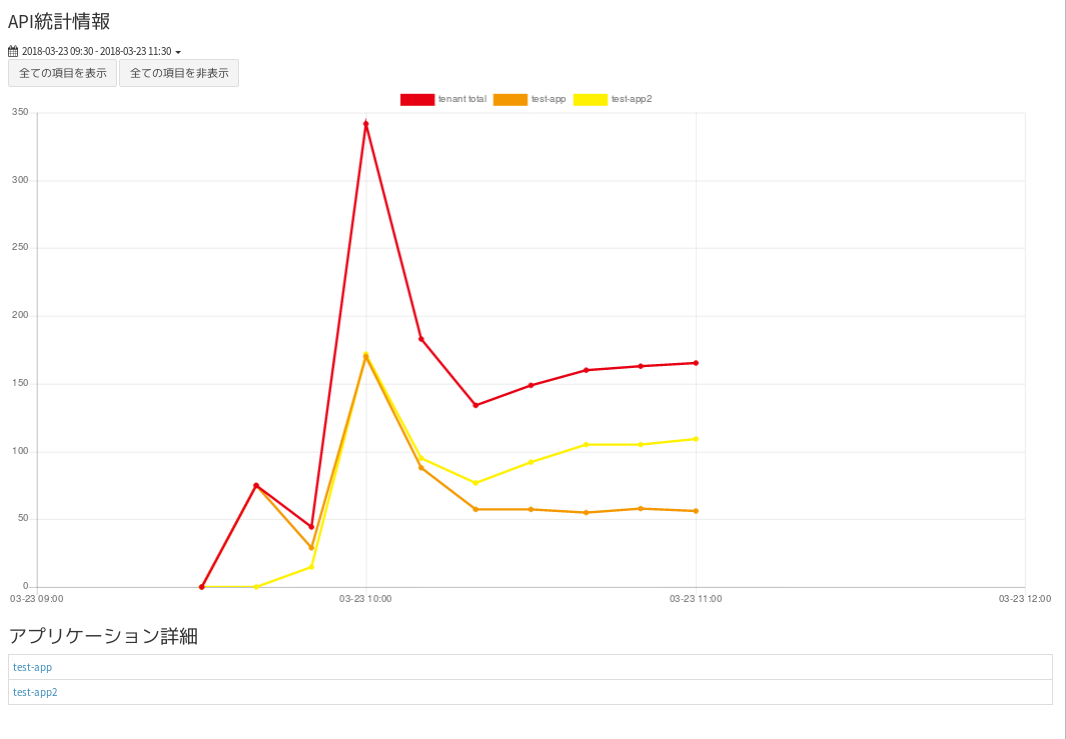
メータリング機能で収集したAPI統計情報をグラフで表示できます。
API呼び出し回数を表示します。データはテナント、アプリケーション毎のAPI呼び出し総数になります。
統計情報の絞込み
API呼び出し回数を、以下の条件で絞込むことができます。
- テナント、アプリケーション
- 開始日時・終了日時の指定
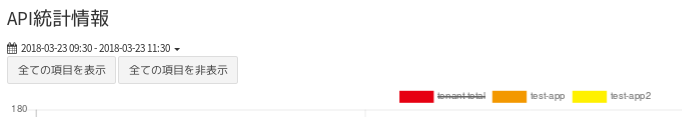
画面上部のテナント、アプリケーションのタグを選択することで表示、非表示を切り替えることができます。
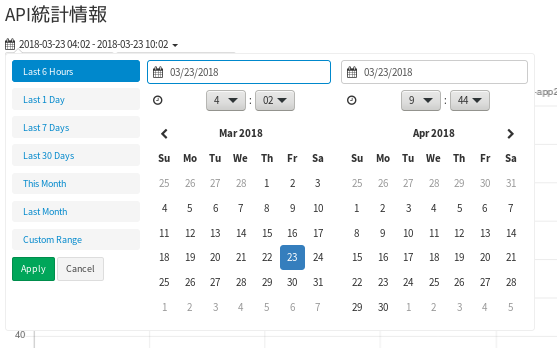
画面左上の日時を選択すると、表示データの期間を変更することができます。 プリセットの値を選択するか、「Coustom Range」選択後に期間を設定し、「Apply」を選択します。
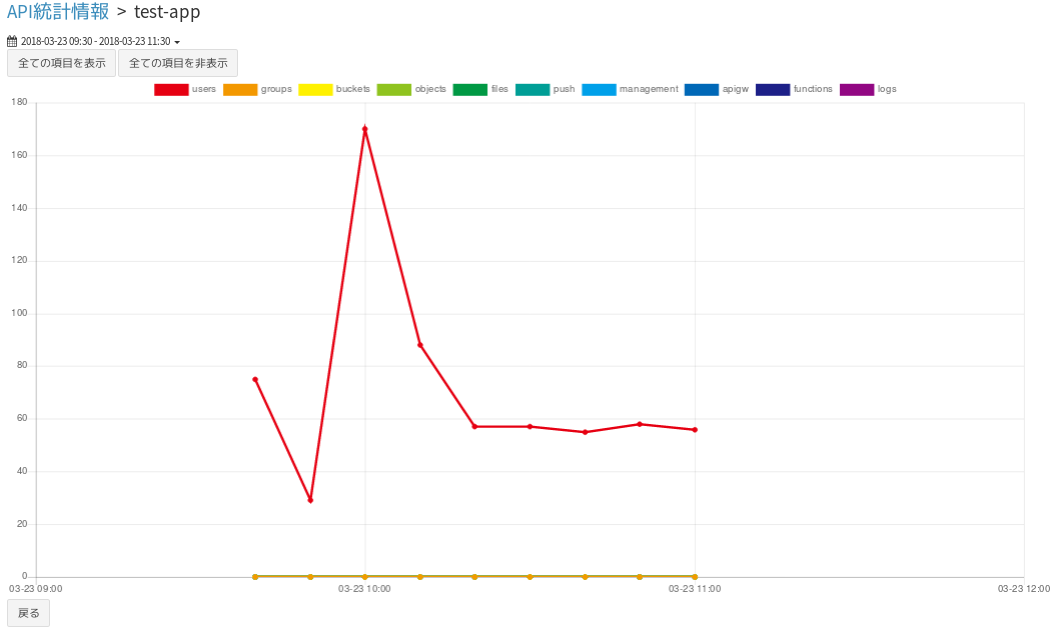
アプリケーション毎の統計情報
「アプリケーション詳細」から、詳細な統計情報を表示することができます。
以下の種別毎にAPI呼び出しの回数を表示します
- users
- groups
- buckets
- objects
- files
- push
- management
- apigw
- functions
- logs